Load testing, general setup

  • Deployed on the 'modest' machines in the test cluster
  • Official install downloaded from kafka.apache.org (version: 2.13-4.1.0)
  • TGZ-file unpacked on server
  • Started with bin/kafka-server-start.sh — along with some monitoring
  • config/server.properties modified:
    • advertised.listeners=PLAINTEXT://[MACHINE_IP]:9092,CONTROLLER://localhost:9093
    • log.retention.hours=2
    • log.retention.bytes=1073741824 # 1GB
    • log.segment.bytes=1073741824 # 1GB
    • log.retention.check.interval.ms=30000

One instance of Kafka

Without a cluster — from the server's perspective — there are 2 ways of sending something to Kafka: with and without confirmation.

3 tests were executed:

  • ACK: Asking for confirmation from the server — at the highest possible throughput.
  • NACK: Not asking for confirmation (at ~the same throughput as ACK)
  • NACKmax: Not asking for confirmation (at ~the same CPU load as ACK)

Image: Pixabay @ Pexels

Server rack

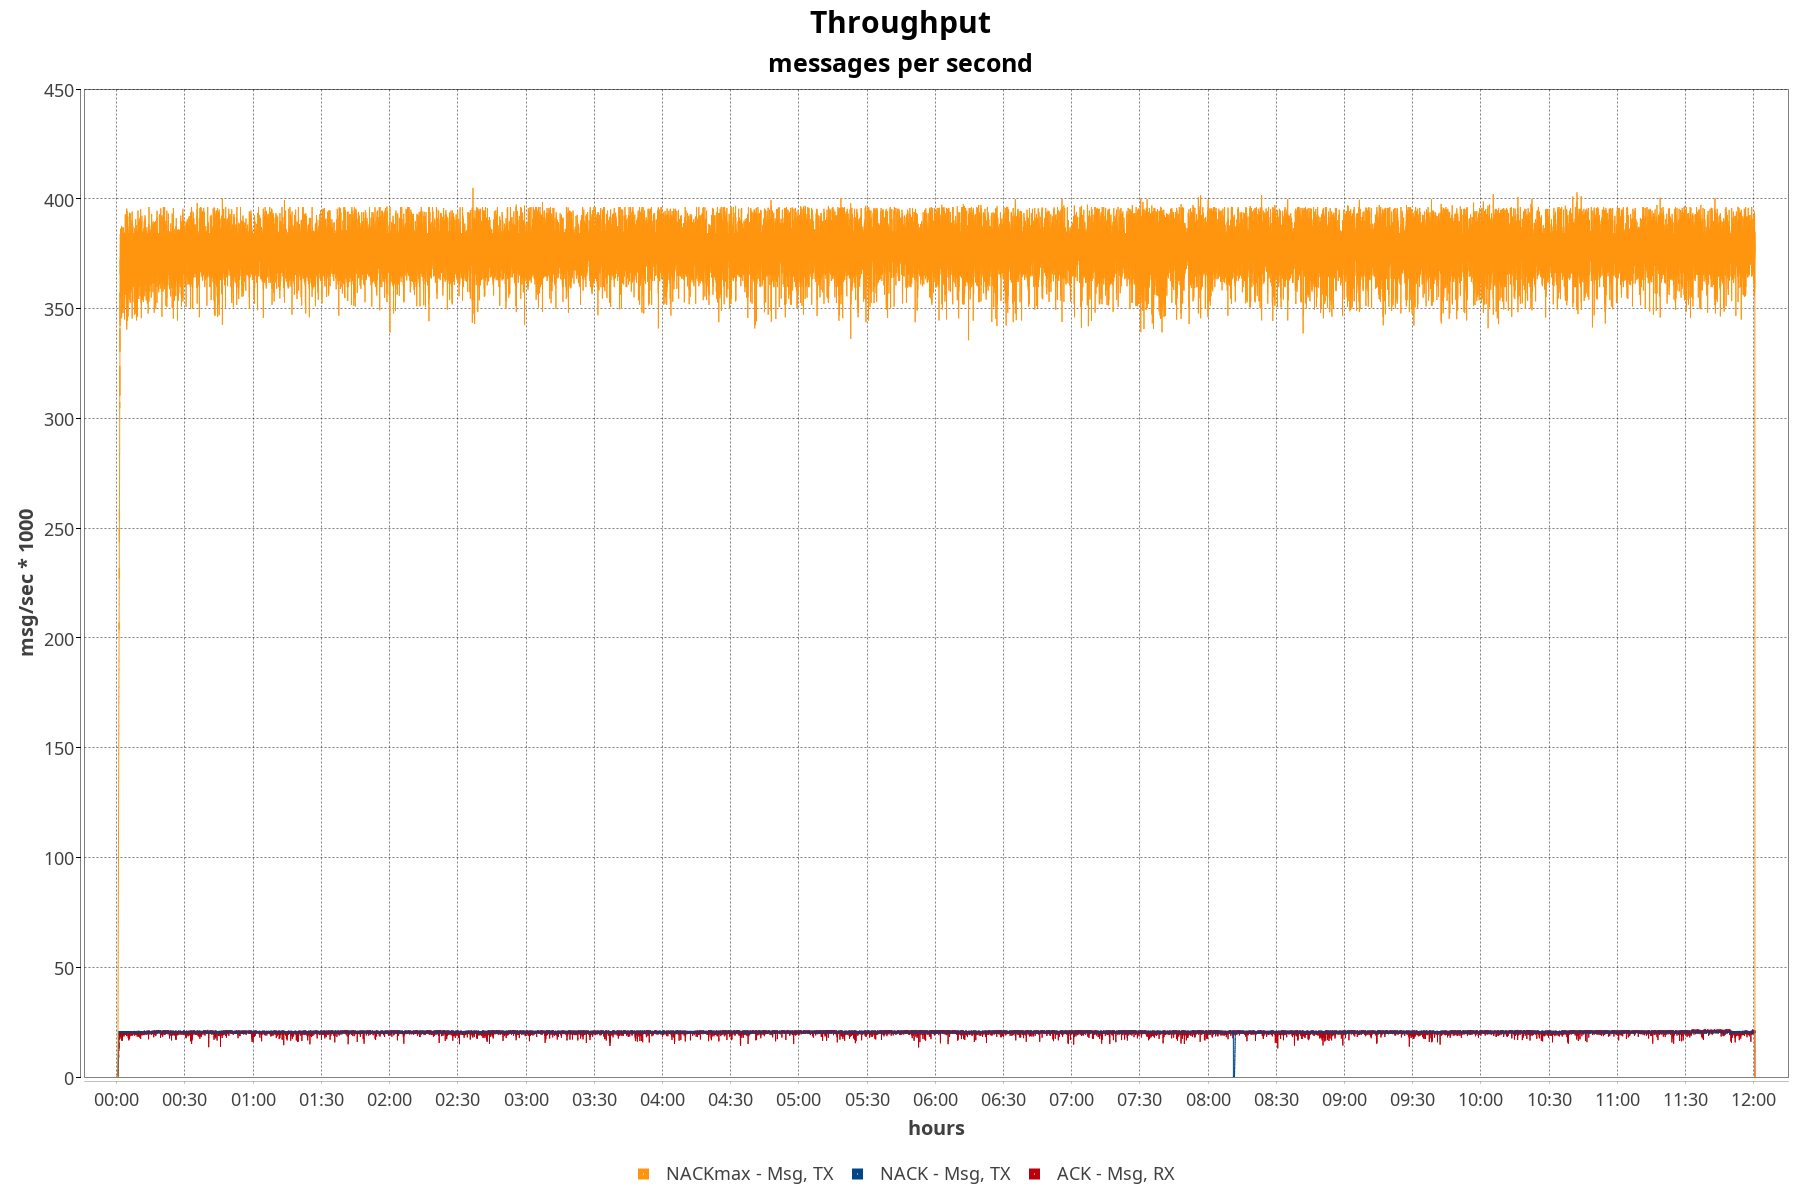
Throughput

There is significantly more bang for your buck if you skip the confirmation.

Throughput comparison

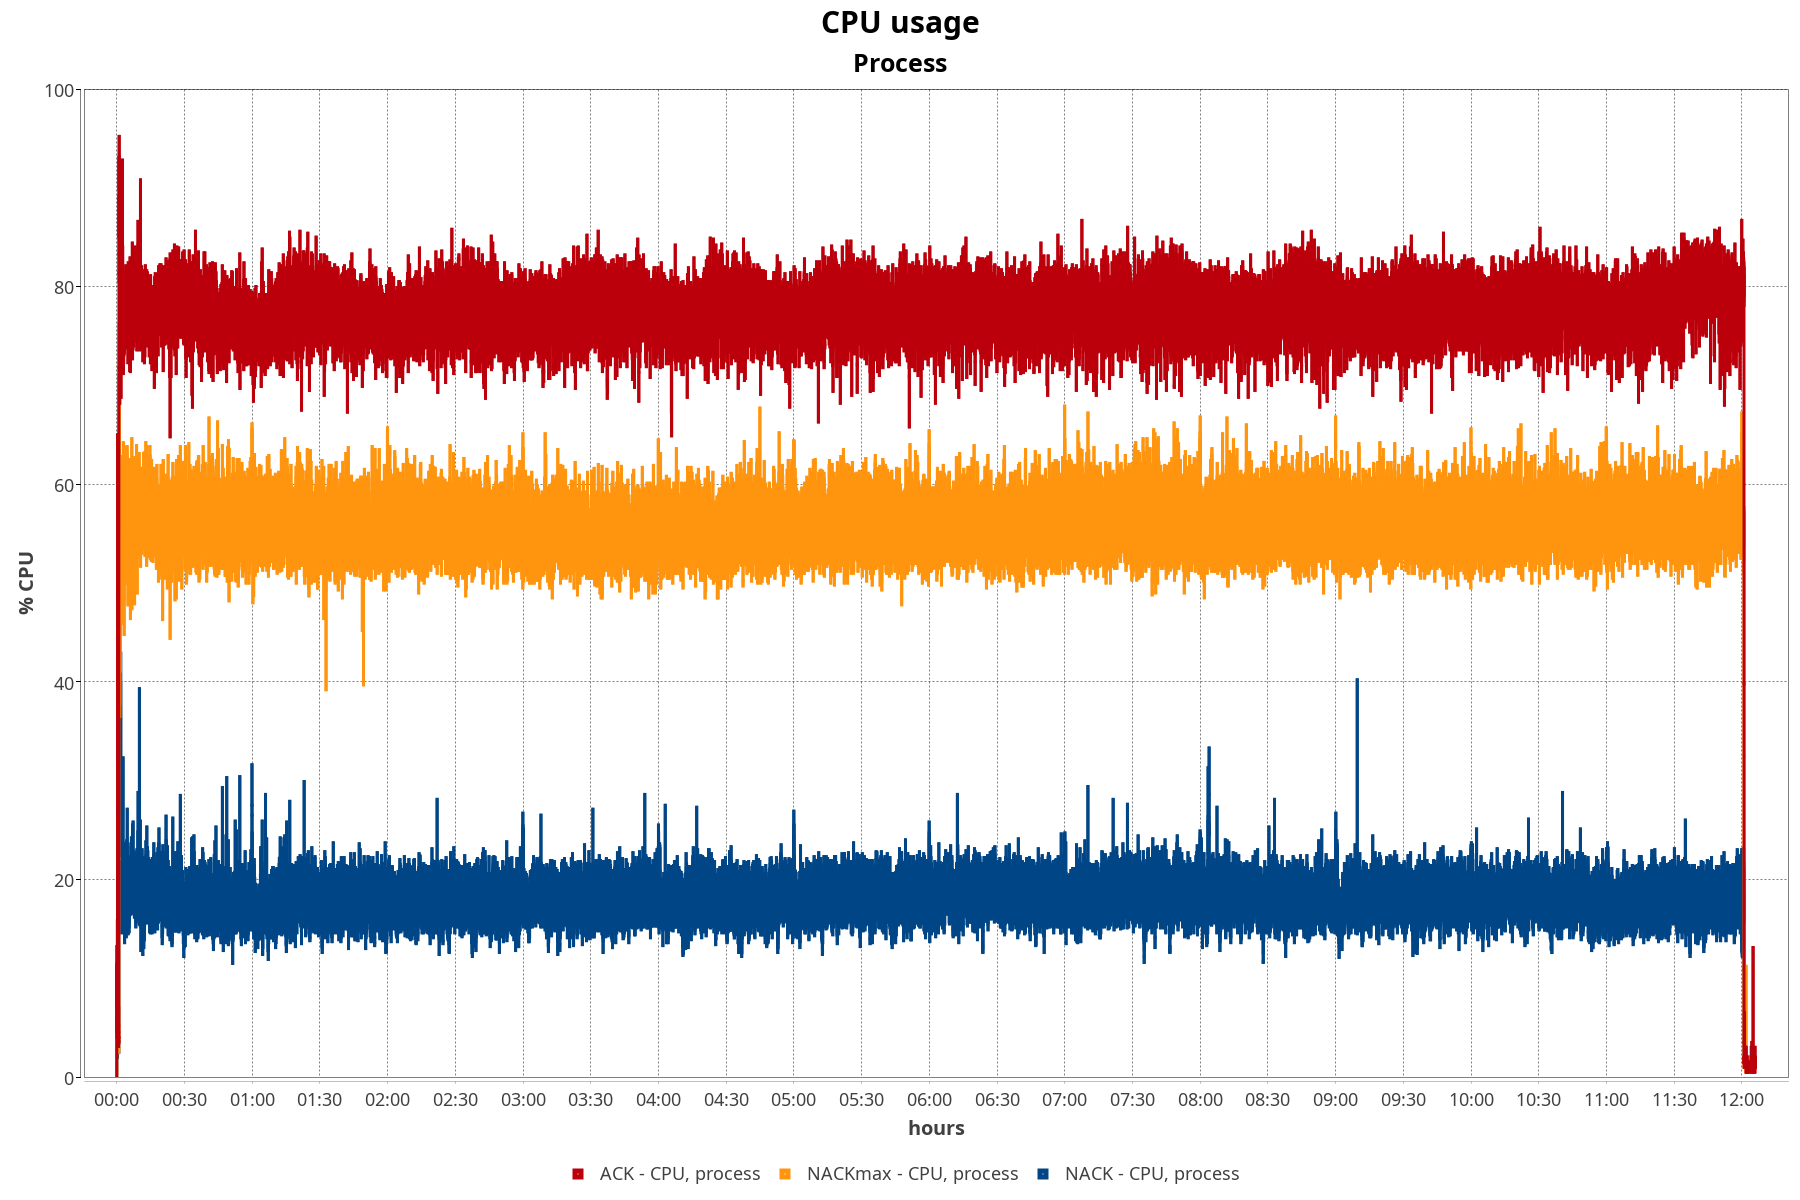
CPU usage

It takes quite a bit more processing to handle the confirmation server-side.
It was not possible to increase load for NACKmax further without running into problems (more about that later).

CPU usage over time

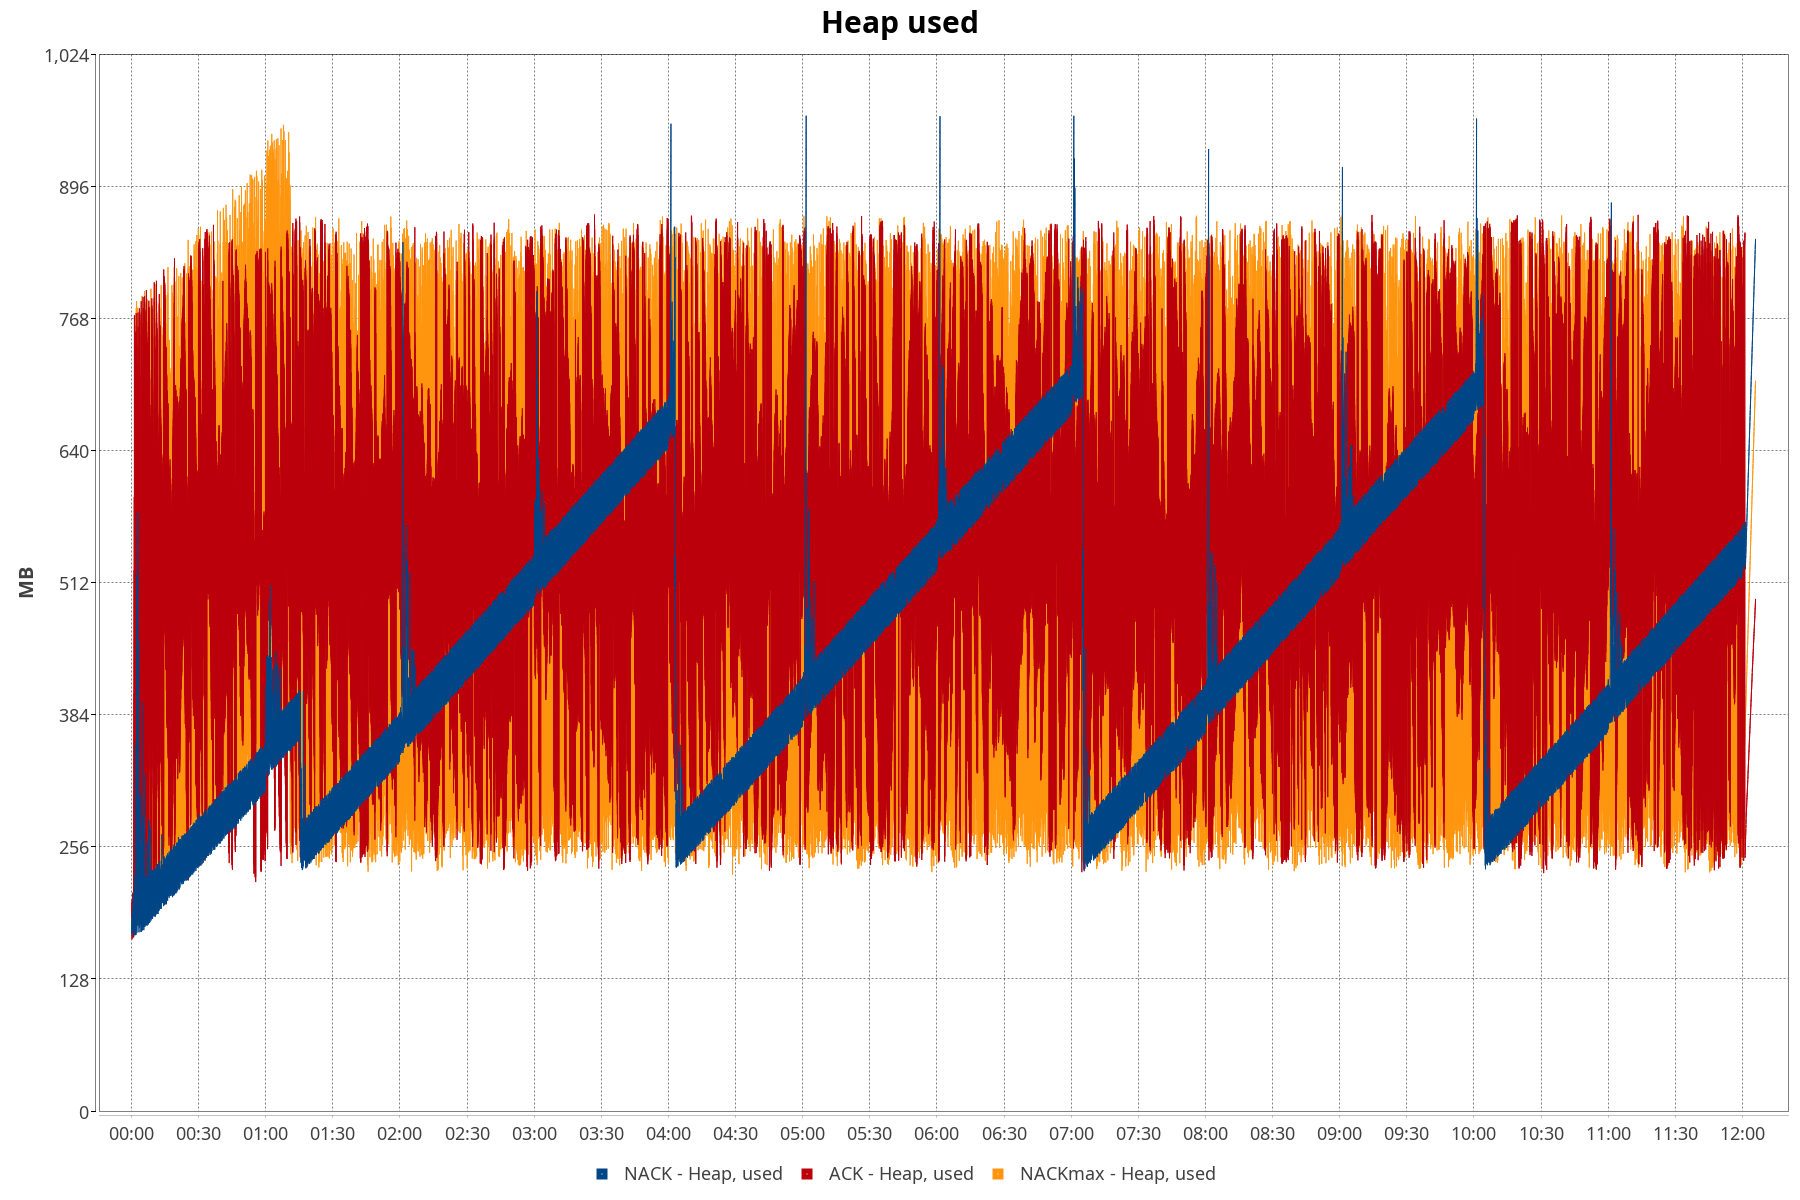
Heap usage

At least in the old days, this was where trouble would usually be. That has changed quite a bit...

All 3 machines were given a max heap of 1 GB. They all look well-behaved. Obviously the NACK at low throughput allocates the least.

There is a spike every hour — probably a cleanup or rebalancing job.

See the note on sampling for context.

Heap memory usage

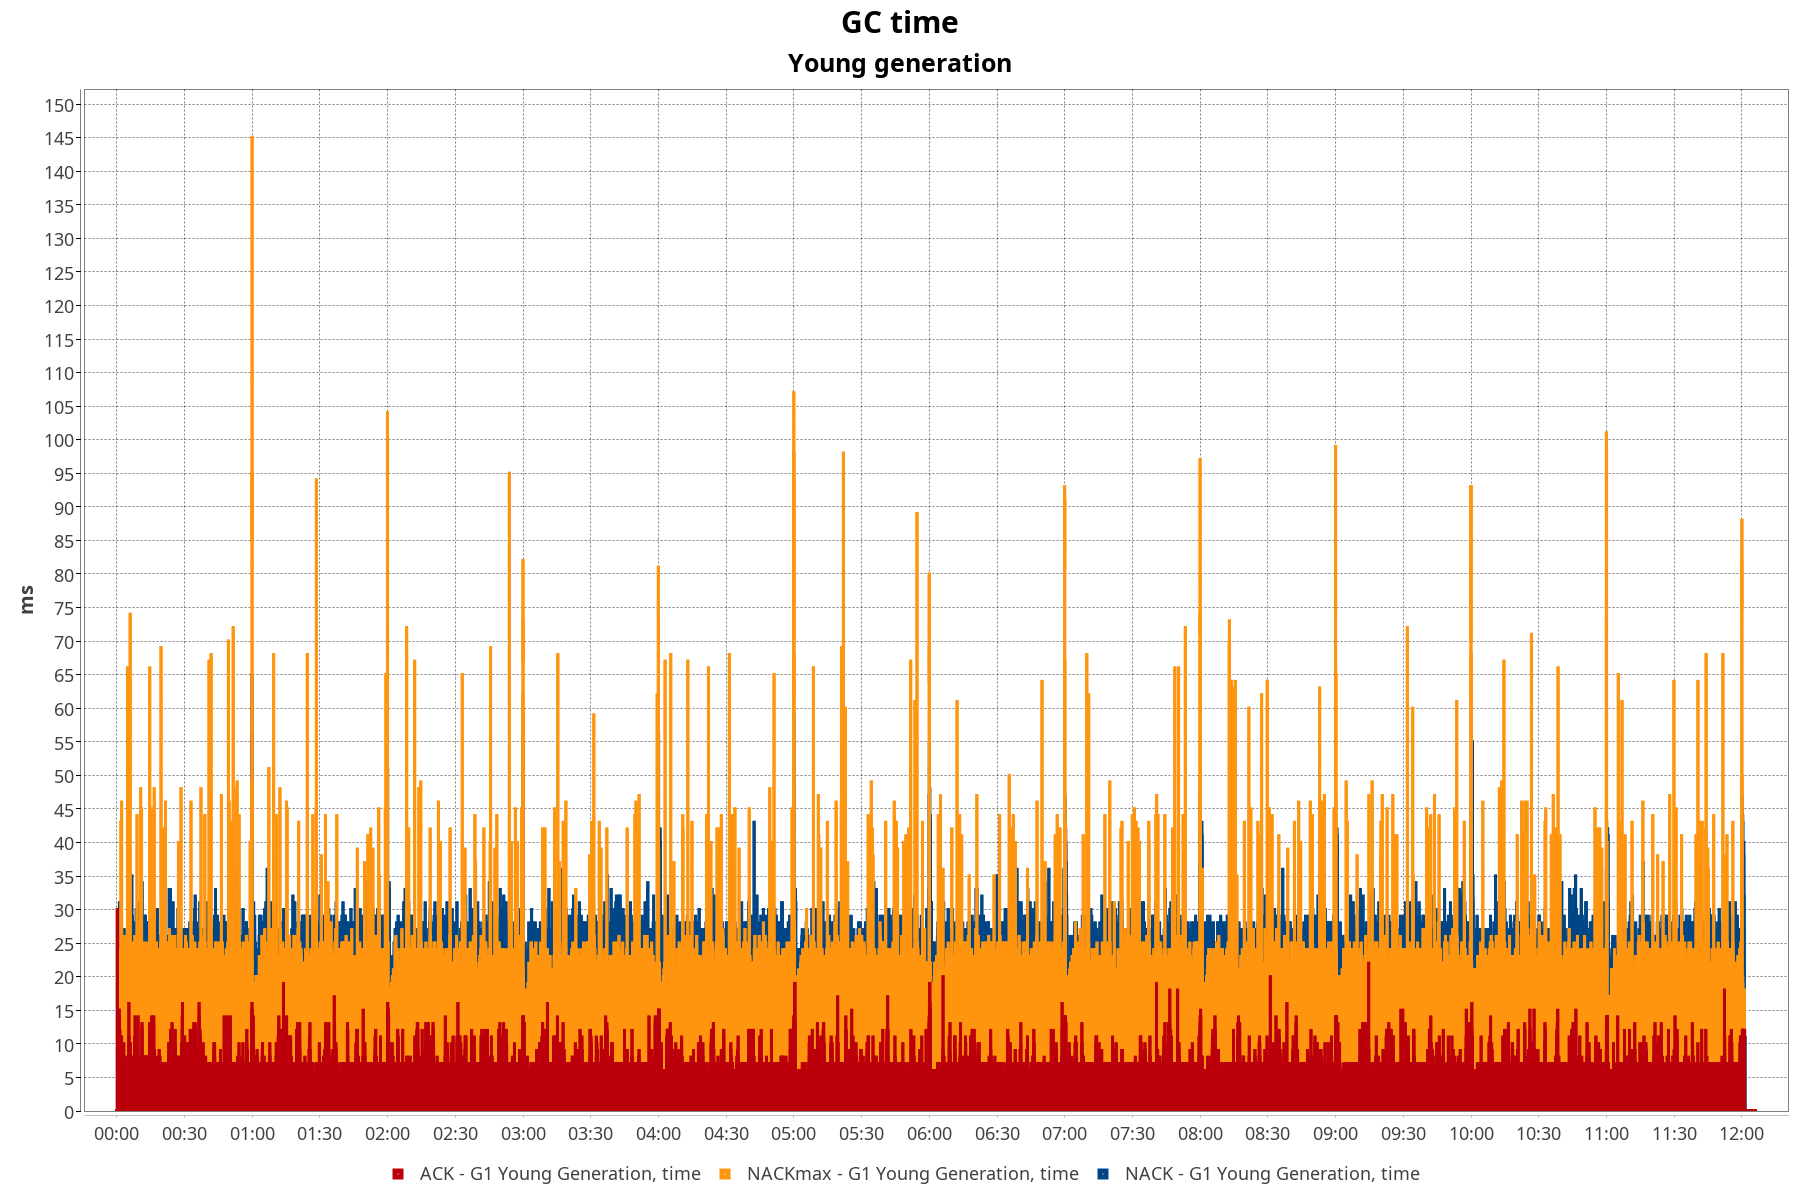
Garbage collection

(G1 is default for Kafka)

The chart shows: “In the last second, how many milliseconds were spent on GC?”
This is the young generation. The Concurrent GC ran for a total of ~50 ms per hour for each instance. The old gen GC didn’t run at all.

Young generation GC time

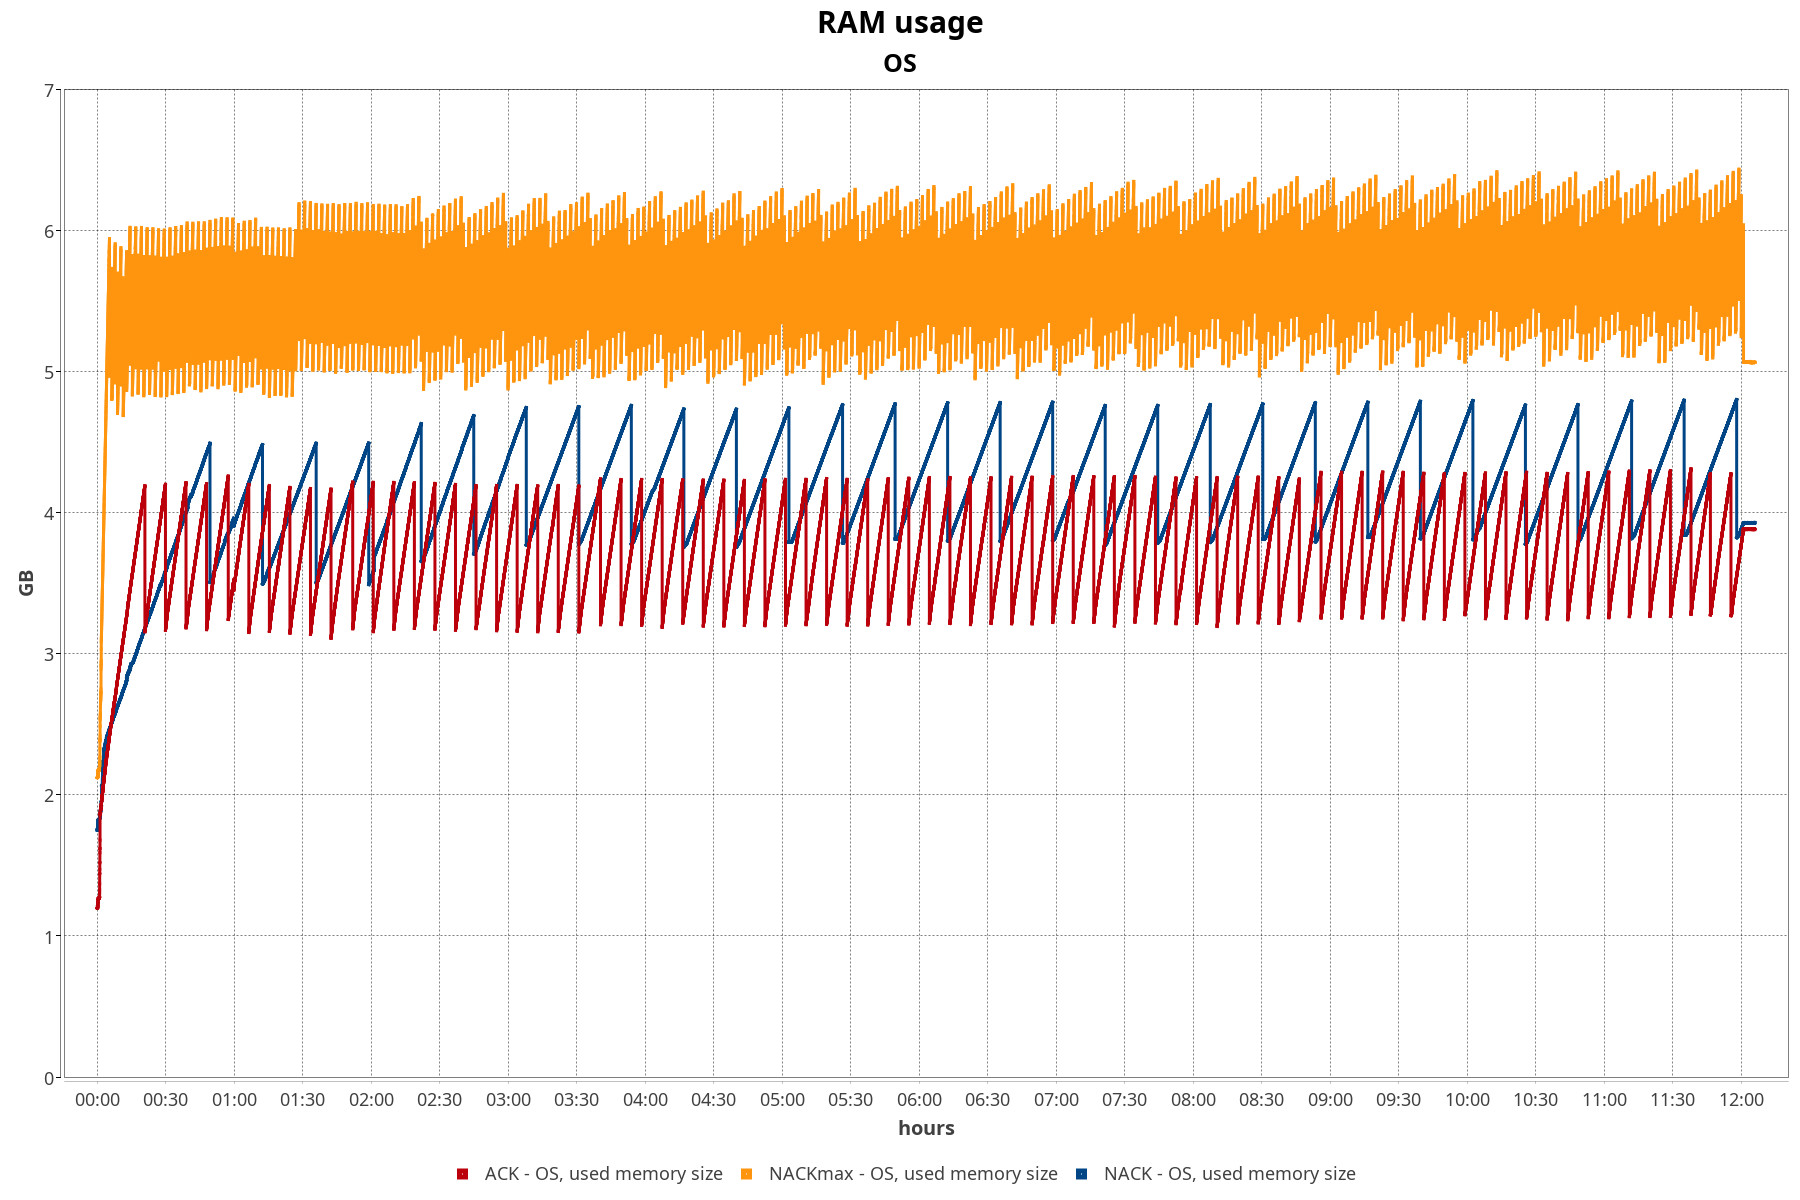
Total RAM usage

As noted earlier, heap used to be the troublemaker. Now it’s more often “non-heap”.

Each JVM was started with 1 GB max heap — but they use significantly more in total. This can be a problem if you run many JVMs on one physical machine, and becomes harder in virtualized or containerized environments.

Total RAM usage

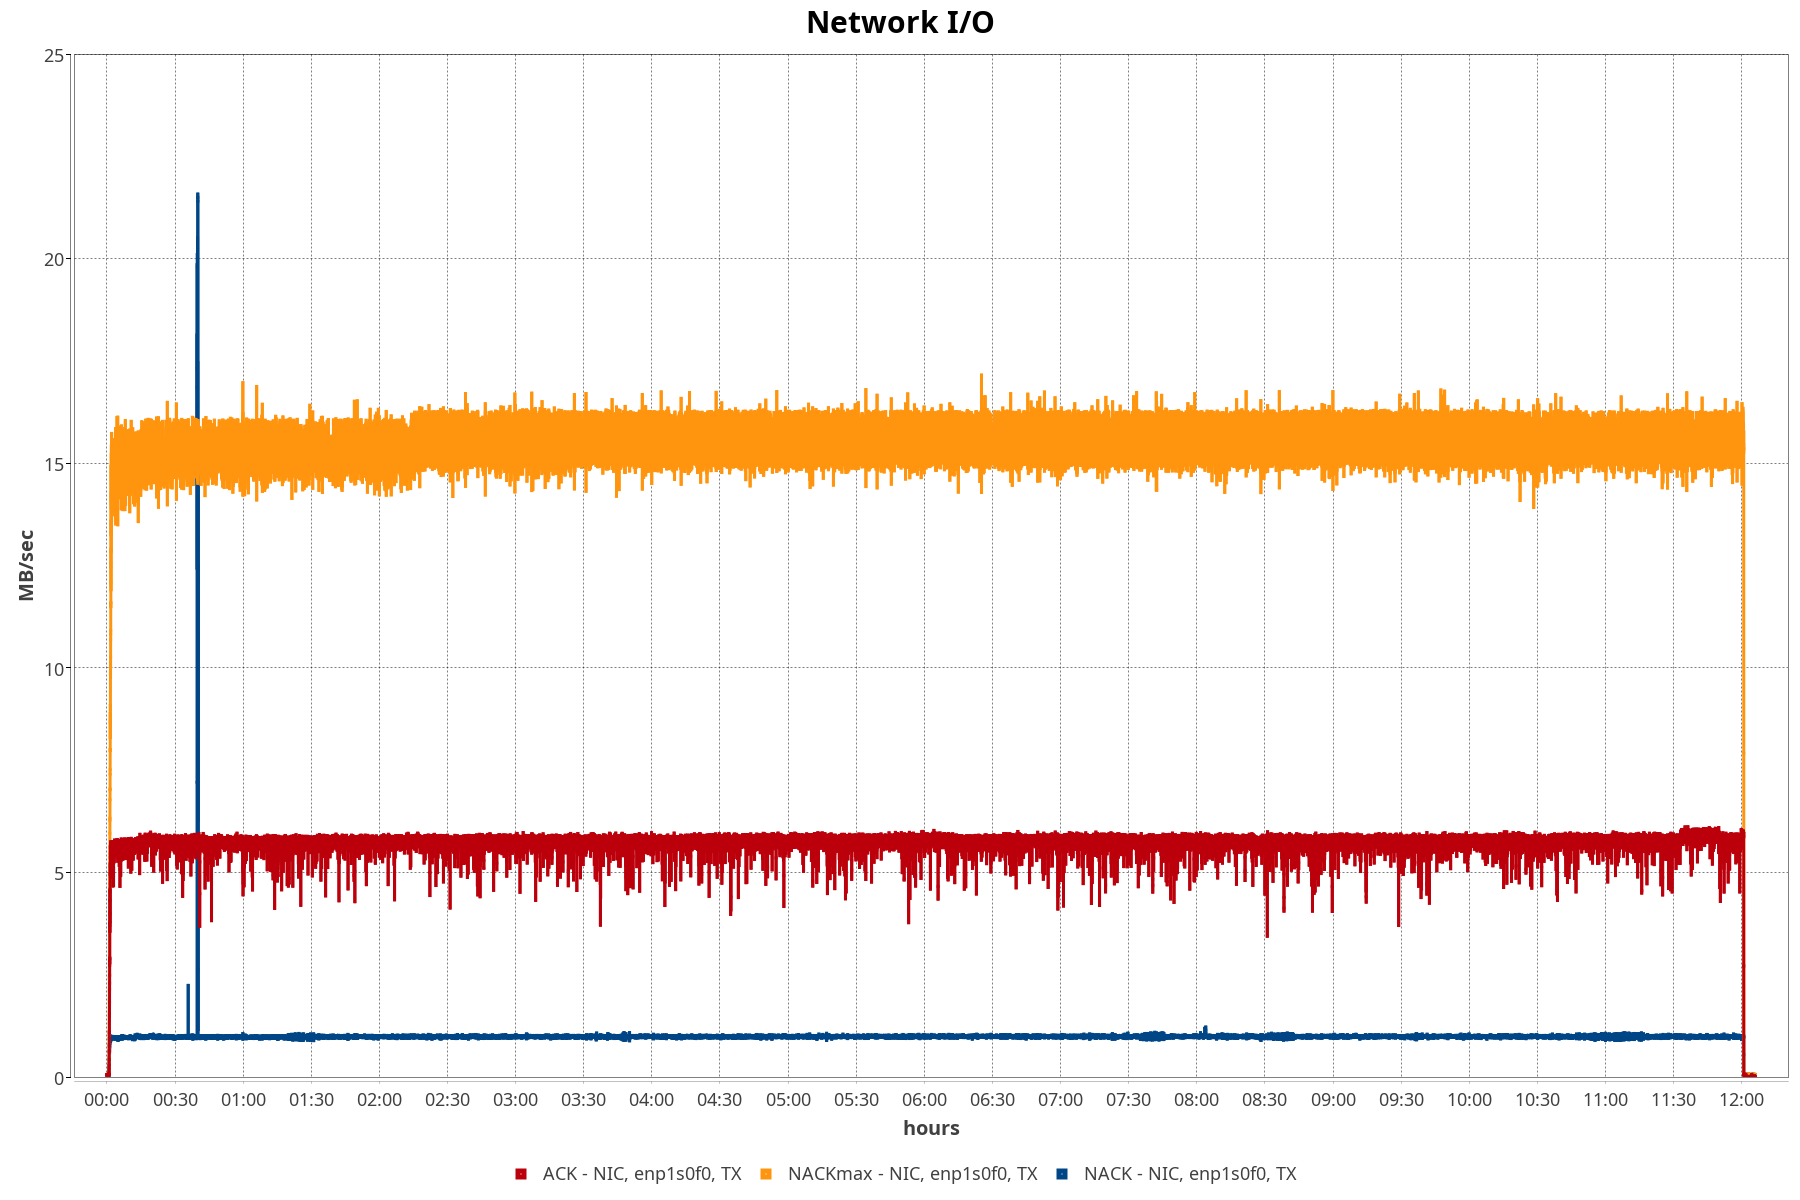
Network I/O

A higher load creates more traffic.

But… it costs ~5× more traffic to get confirmation from the server. A lot of chatter for not that much difference.

Network I/O over time

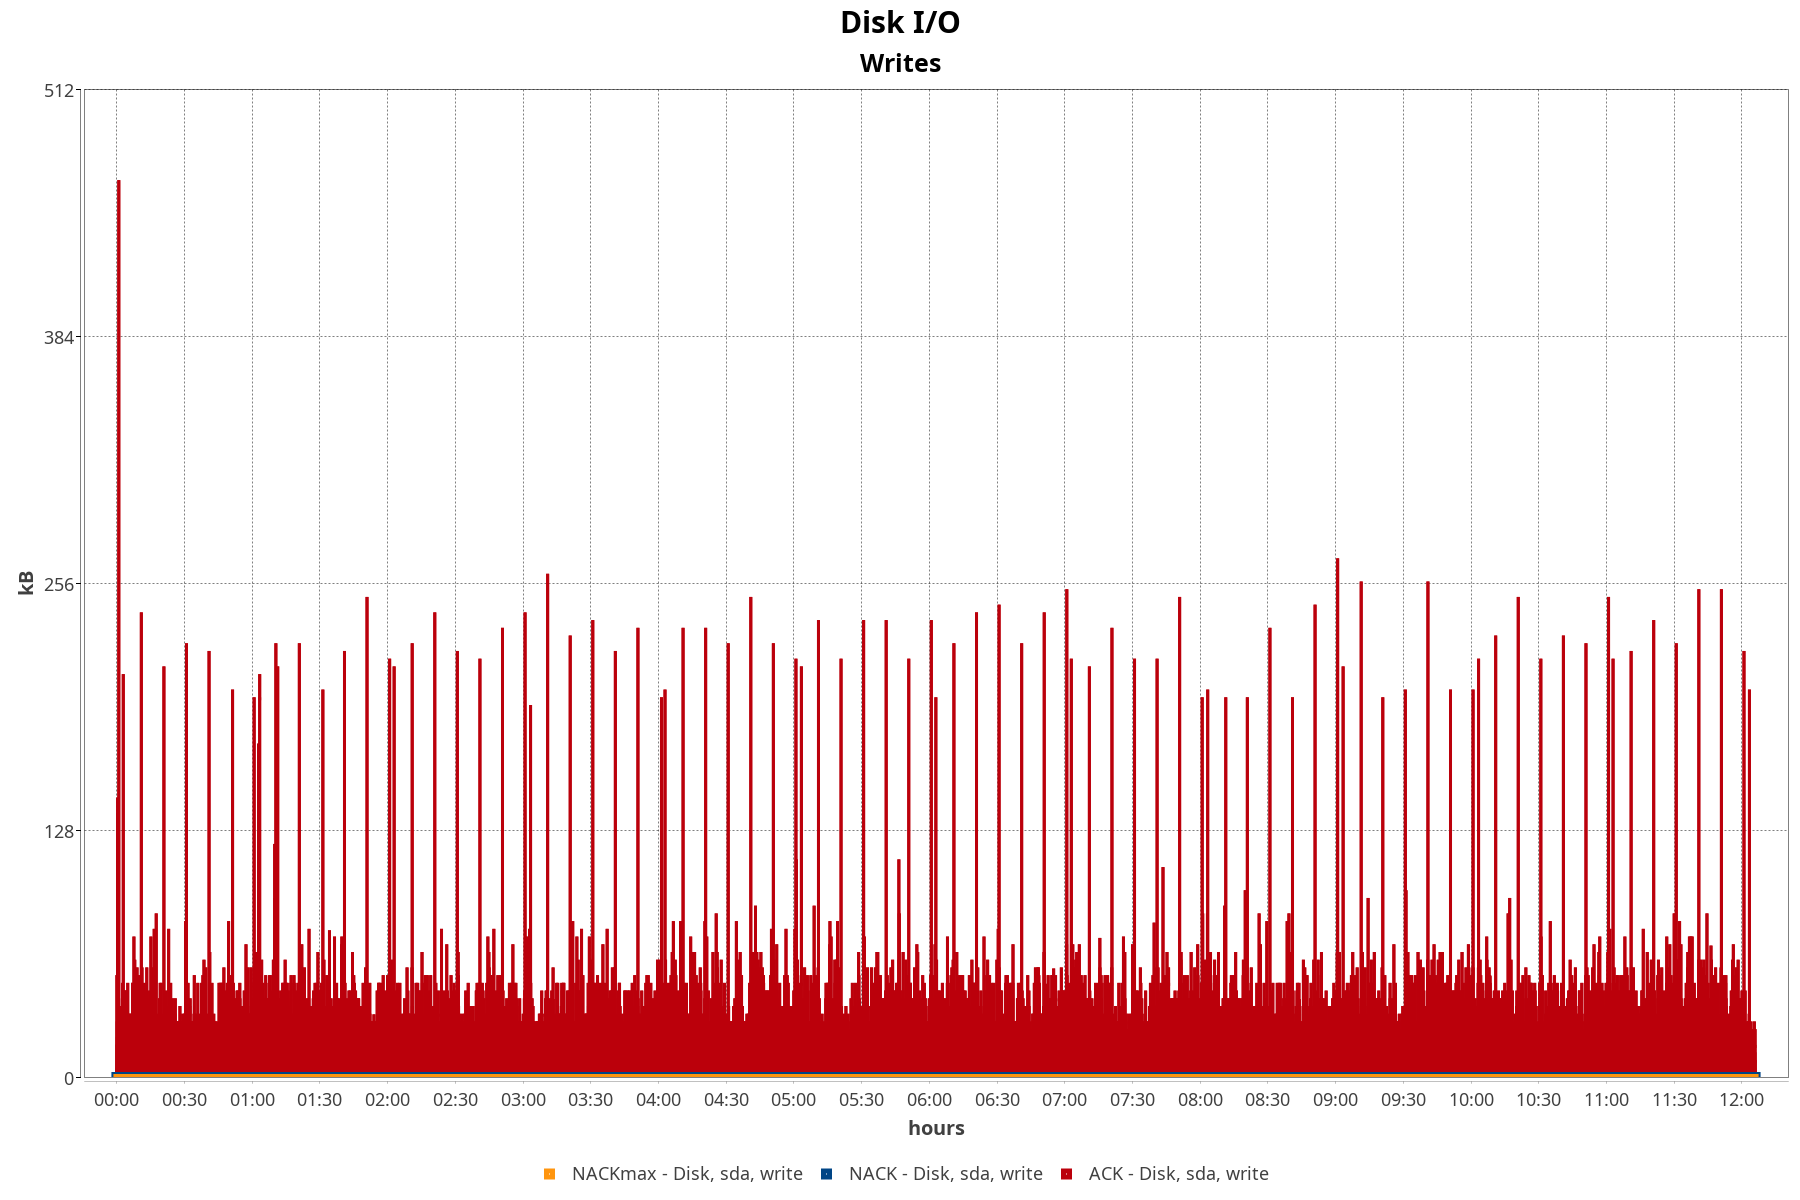
Disk I/O

When the server is asked to confirm, it also writes to disk.

Disk write I/O
× Enlarged chart